
More people are moving to Gauteng than the Western Cape according to Statistics South Africa.
Image: ChatGPT
Work – not lifestyle or family – is the primary force reshaping where South Africans live, with more than a quarter of internal migrants relocating in search of paid employment, according to the latest Migration Statistics Report based on the 2022/23 Income and Expenditure Survey.
The data shows 28.1% of internal migrants moved for work, underscoring the extent to which economic opportunity continues to drive mobility across provincial borders.
Statistics South Africa estimates that 9.1 million lifetime migrants have crossed provinces, with Gauteng drawing the largest share at 4.6 million people. The Western Cape followed with 1.5 million.
Between November 2017 and November 2022 alone, 1.53 million period migrants relocated, with the strongest flows recorded from Limpopo to Gauteng (13.4%) and KwaZulu-Natal to Gauteng (7.2%).
The figures highlight Gauteng’s continued dominance as the country’s economic hub, even as broader economic growth remains subdued.
South Africa is also home to more than three million immigrants, accounting for 5.1% of the population. Nearly two-thirds, or 63.6%, originate from countries within the Southern African Development Community.
Men make up the majority (56%) of immigrants, with the largest cohort aged between 35 and 39, placing most within prime working years.
The report finds that internal migrant households recorded the highest average income at R253,837 a year, alongside average expenditure of R158,409 – above both non-migrant and immigrant-headed households. Across all groups, income from work remained the main source of earnings.
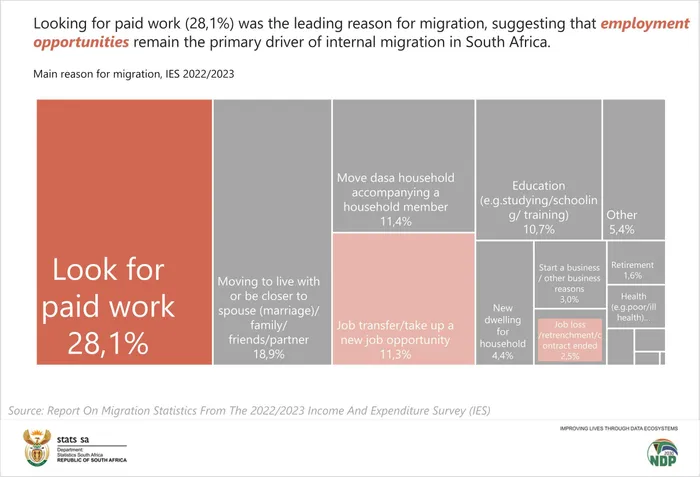
The main reasons people look for work.
Image: Statistics South Africa
Spending patterns further reflect economic positioning. Housing, water, electricity, gas and other fuels accounted for the largest share of household expenditure.
Internal migrants spent an average of R49,415 in this category, compared with R44,611 for non-migrants and R37,981 for immigrants.
Education data, however, points to structural gaps. While 18.4% of South African-born children attended crèches or educare centres, the figure was slightly lower at 16.6% among immigrant children.
Among those aged five to 18, almost a quarter of immigrants reported never attending an educational institution, compared with 5.3% of South African-born children.
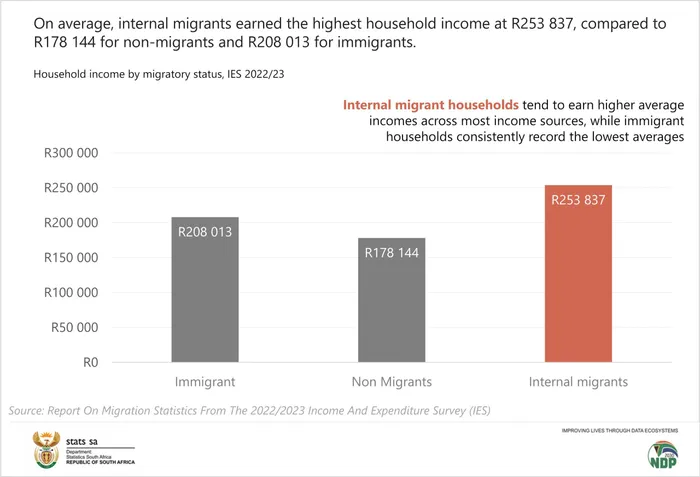
Average income for migrants and immigrants.
Image: Statistics South Africa
Health indicators show that most people aged 15 and older rated their health positively. Among immigrants, 56% described their health as good, a higher figure than that of South African-born individuals.
Public clinics were the primary healthcare access point for both groups, used by 77.7% of immigrants and 69.3% of locals, underscoring reliance on state health services.
Despite socio-economic pressures, 31.7% of immigrants said they feel happier than they did a decade ago, compared with a quarter of the South African-born population.
The Migration Statistics Report provides a detailed snapshot of how movement within and into South Africa is reshaping income patterns, service demand and labour market dynamics – reinforcing that economic opportunity remains the central driver of mobility in the country.
IOL BUSINESS